What is visualisation ?
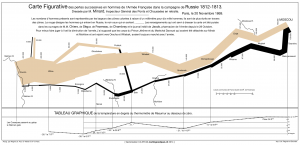
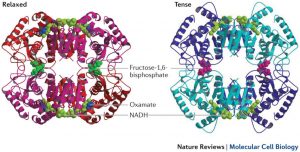
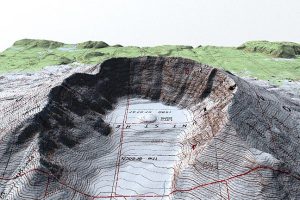
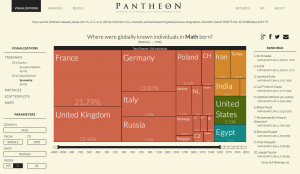
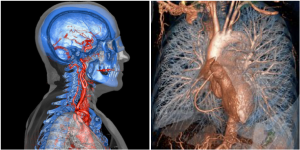
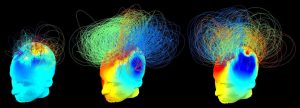
Scientific visualisation, information visualisation, and visual data analytics are the three main branches of visualisation which refers to the production of graphical representations of scientific phenomena as a means of understanding and getting insight into data:
- Scientific visualisation provides 3D representation of simulated phenomena and sampled data with applications in application fields.
- Information visualisation is the study of interactive visual representations of abstract data to enhance human cognition.
- Visual data analytics is an outgrowth of the two previous fields that focuses on analytical reasoning through interactive visual interfaces.
Visualisation at ISCD
Our new Center for Data Visualisation (CDV, launched in 2020), has been designed as an open and interactive environment to share experiences between users and to foster collaborative interdisciplinary efforts. In addition to providing state-of-the-art technologies, ISCD staff is helping researchers to investigate their data visually using advanced software.

Commitment
Specializing in visualization, data analytics, and computational resources for the interactive exploration of scientific data
Our affiliates are taking an active part in the development of new visualisation methods, to efficiently process their own data. They are no longer restricted to use currently available modelling and visualisation software.

Vision
Bridging the gap between game engine and scientific visualisation through advanced techniques for research and training
We want to foster knowledge about visualisation techniques to further advance research topics.
At ISCD, affiliates can explore novel technologies: 3D virtual environments, interactive data visualization, visual analytics, information and scientific visualization.

Actions
Collaborating with researchers to accelerate discoveries through data visualization, computing and data sciences
We support the needs of our affiliates by providing access to, and training on state-of-the-art visualization hardware and software for scientific investigation. Efforts are already underway through collaborations, working groups, summer schools initiatives, PhDs, ...
Activities & Projects
The Centre for Data Visualisation is a place where all ISCD affiliates may do visualization research. The list below shows activities and results from some of our application fields, done by or with the help of research assistants from the lab.The centre for Data Visualisation is primarily focussed on generating intuitive and insightful visualization applications from simulated or experimental data and, on the other hand, for outreach and education, to communicate scientific results. Scientists are facing diverse tools and complex workflows, often preventing them from getting the highest visual rendering of their results.
“The gap in visual quality between scientific content and entertainment content has never been bigger.” (Nvidia)To overcome this problem, our group specializes in designing applications that seamlessly combine data from different sources to produce high-quality renderings. We show how data from simulations can be embedded in interactive applications based on game engines (Unreal, Unity) to greatly simplify and enhance scientific visualisation.
The Scientific Visualisation group is primarily dedicated on foundations and practical applications of mathematical approaches to scientific visualisation. Here, our goal is to generate intuitive and insightful visualizations from abstract data from a variety of sources, such as for example numerical simulation or physical experiment. We have gathered experts in algebraic and topological analysis (vector and tensor fields) as well as scientists from many disciplines. We are also interested the connection between visualisation and High-Performance Computing to support our team-projects.
Staff and Affiliates

Frey, Pascal
Institut des sciences du calcul et des données

Guennou, Chloé
Institut des sciences du calcul et des données (ISCD)

Guihéneuf, Pierre-Antoine
Institut de Mathématiques de Jussieu (IMJ)

Leys, Nicolas
Institut des sciences du calcul et des données (ISCD)

Tierny, Julien
Laboratoire d'Informatique de Paris 6 (LiP6)

